
Data Visualization
True growth demands more than intuition; it requires a clear vantage point. Our Metrics Dashboards serve as the "pulse" of our ecosystem, distilling complex KPIs into a visual narrative of performance. By mapping evolution over time, these tools do more than record data—they expose the pain points that define our next steps. We believe no system is ever "finished." These insights are the compass for our continuous improvement and deeper connection.
ABout this portal
My contributions:
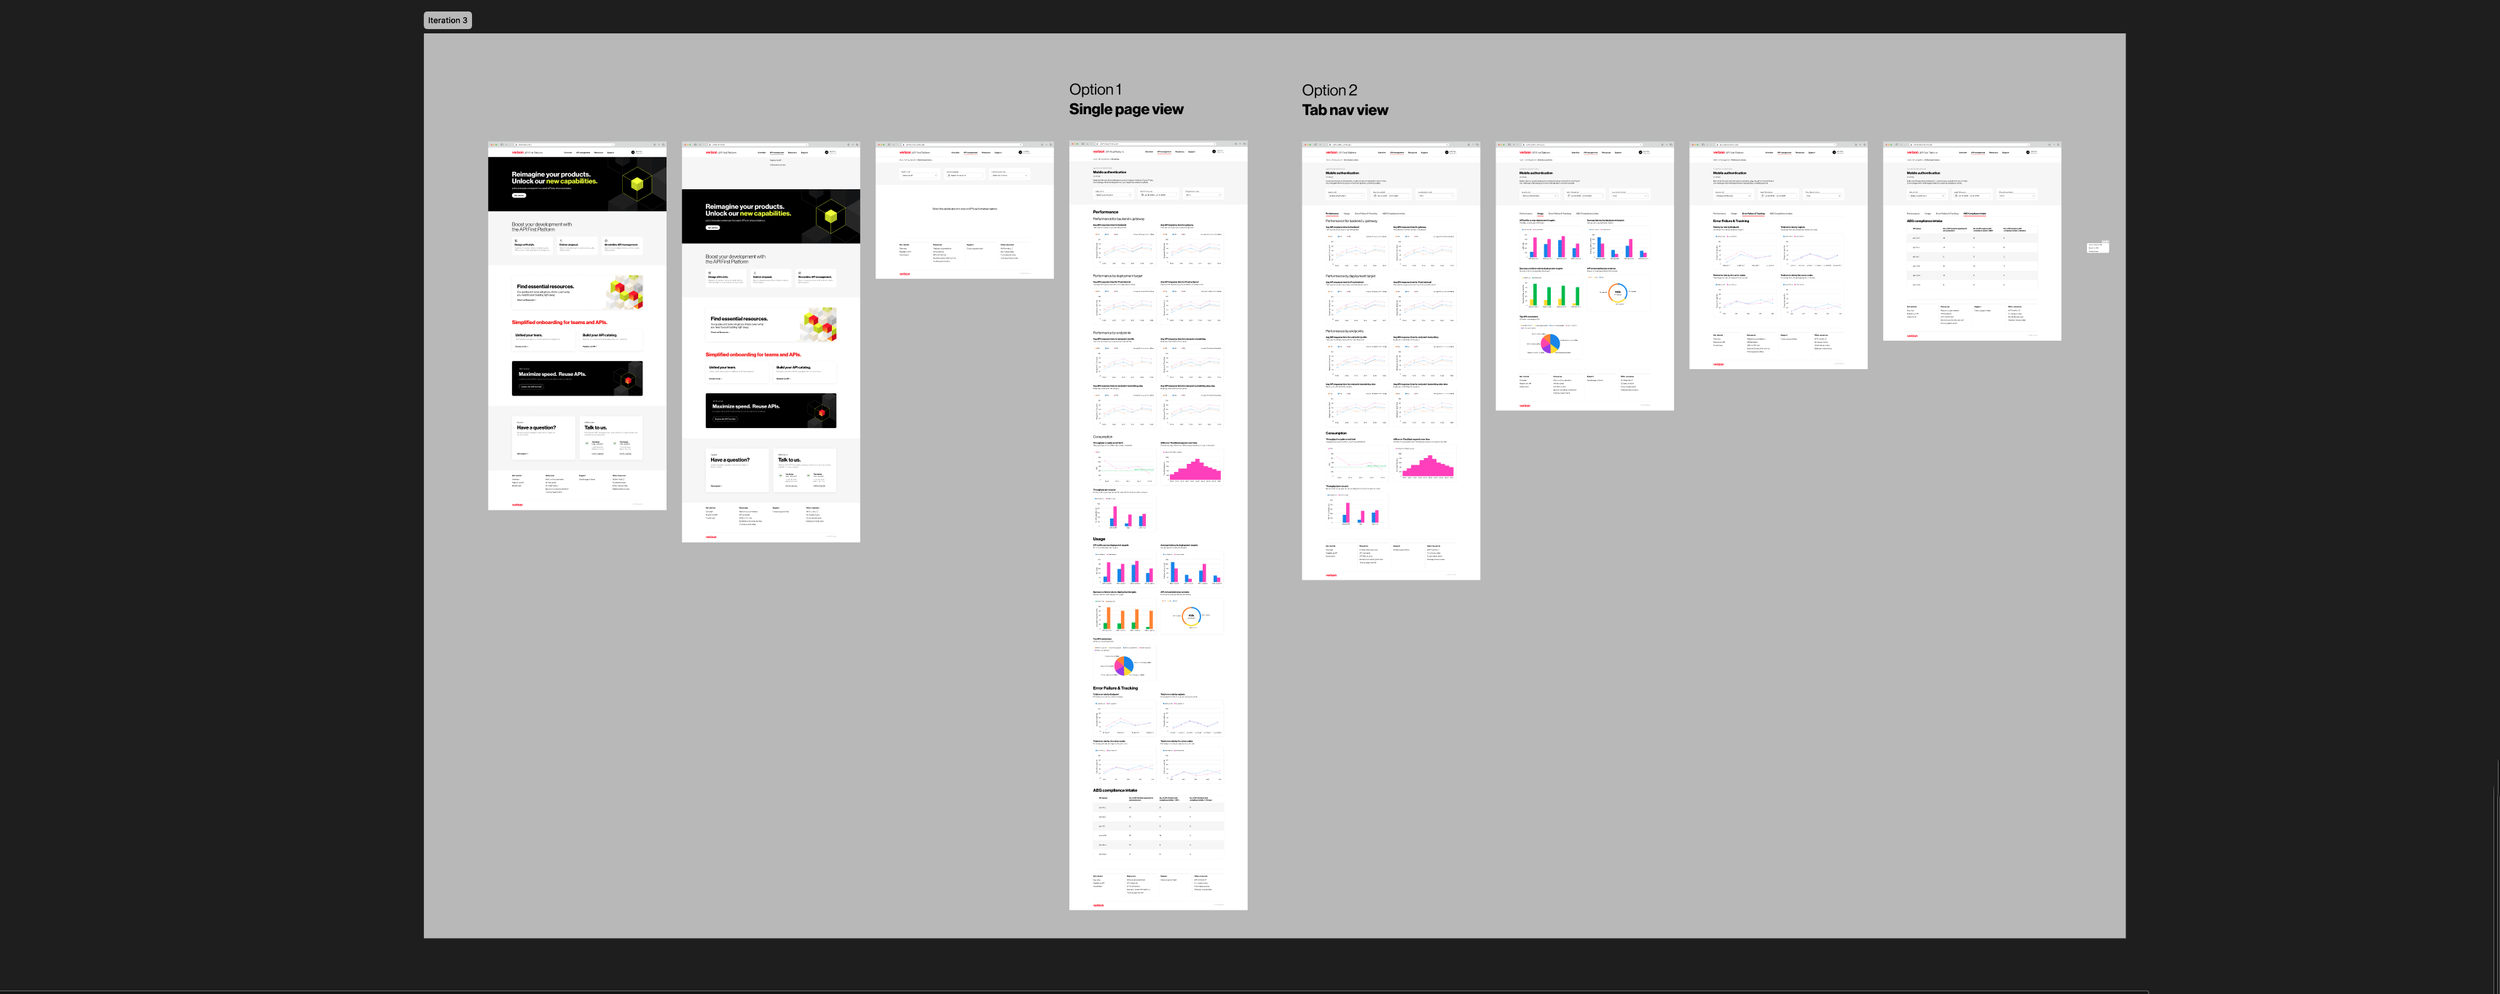
Data Experience Lead: Spearheaded the end-to-end design for the metrics ecosystem, transforming complex raw data into a strategic narrative for the Vice President and senior leadership.
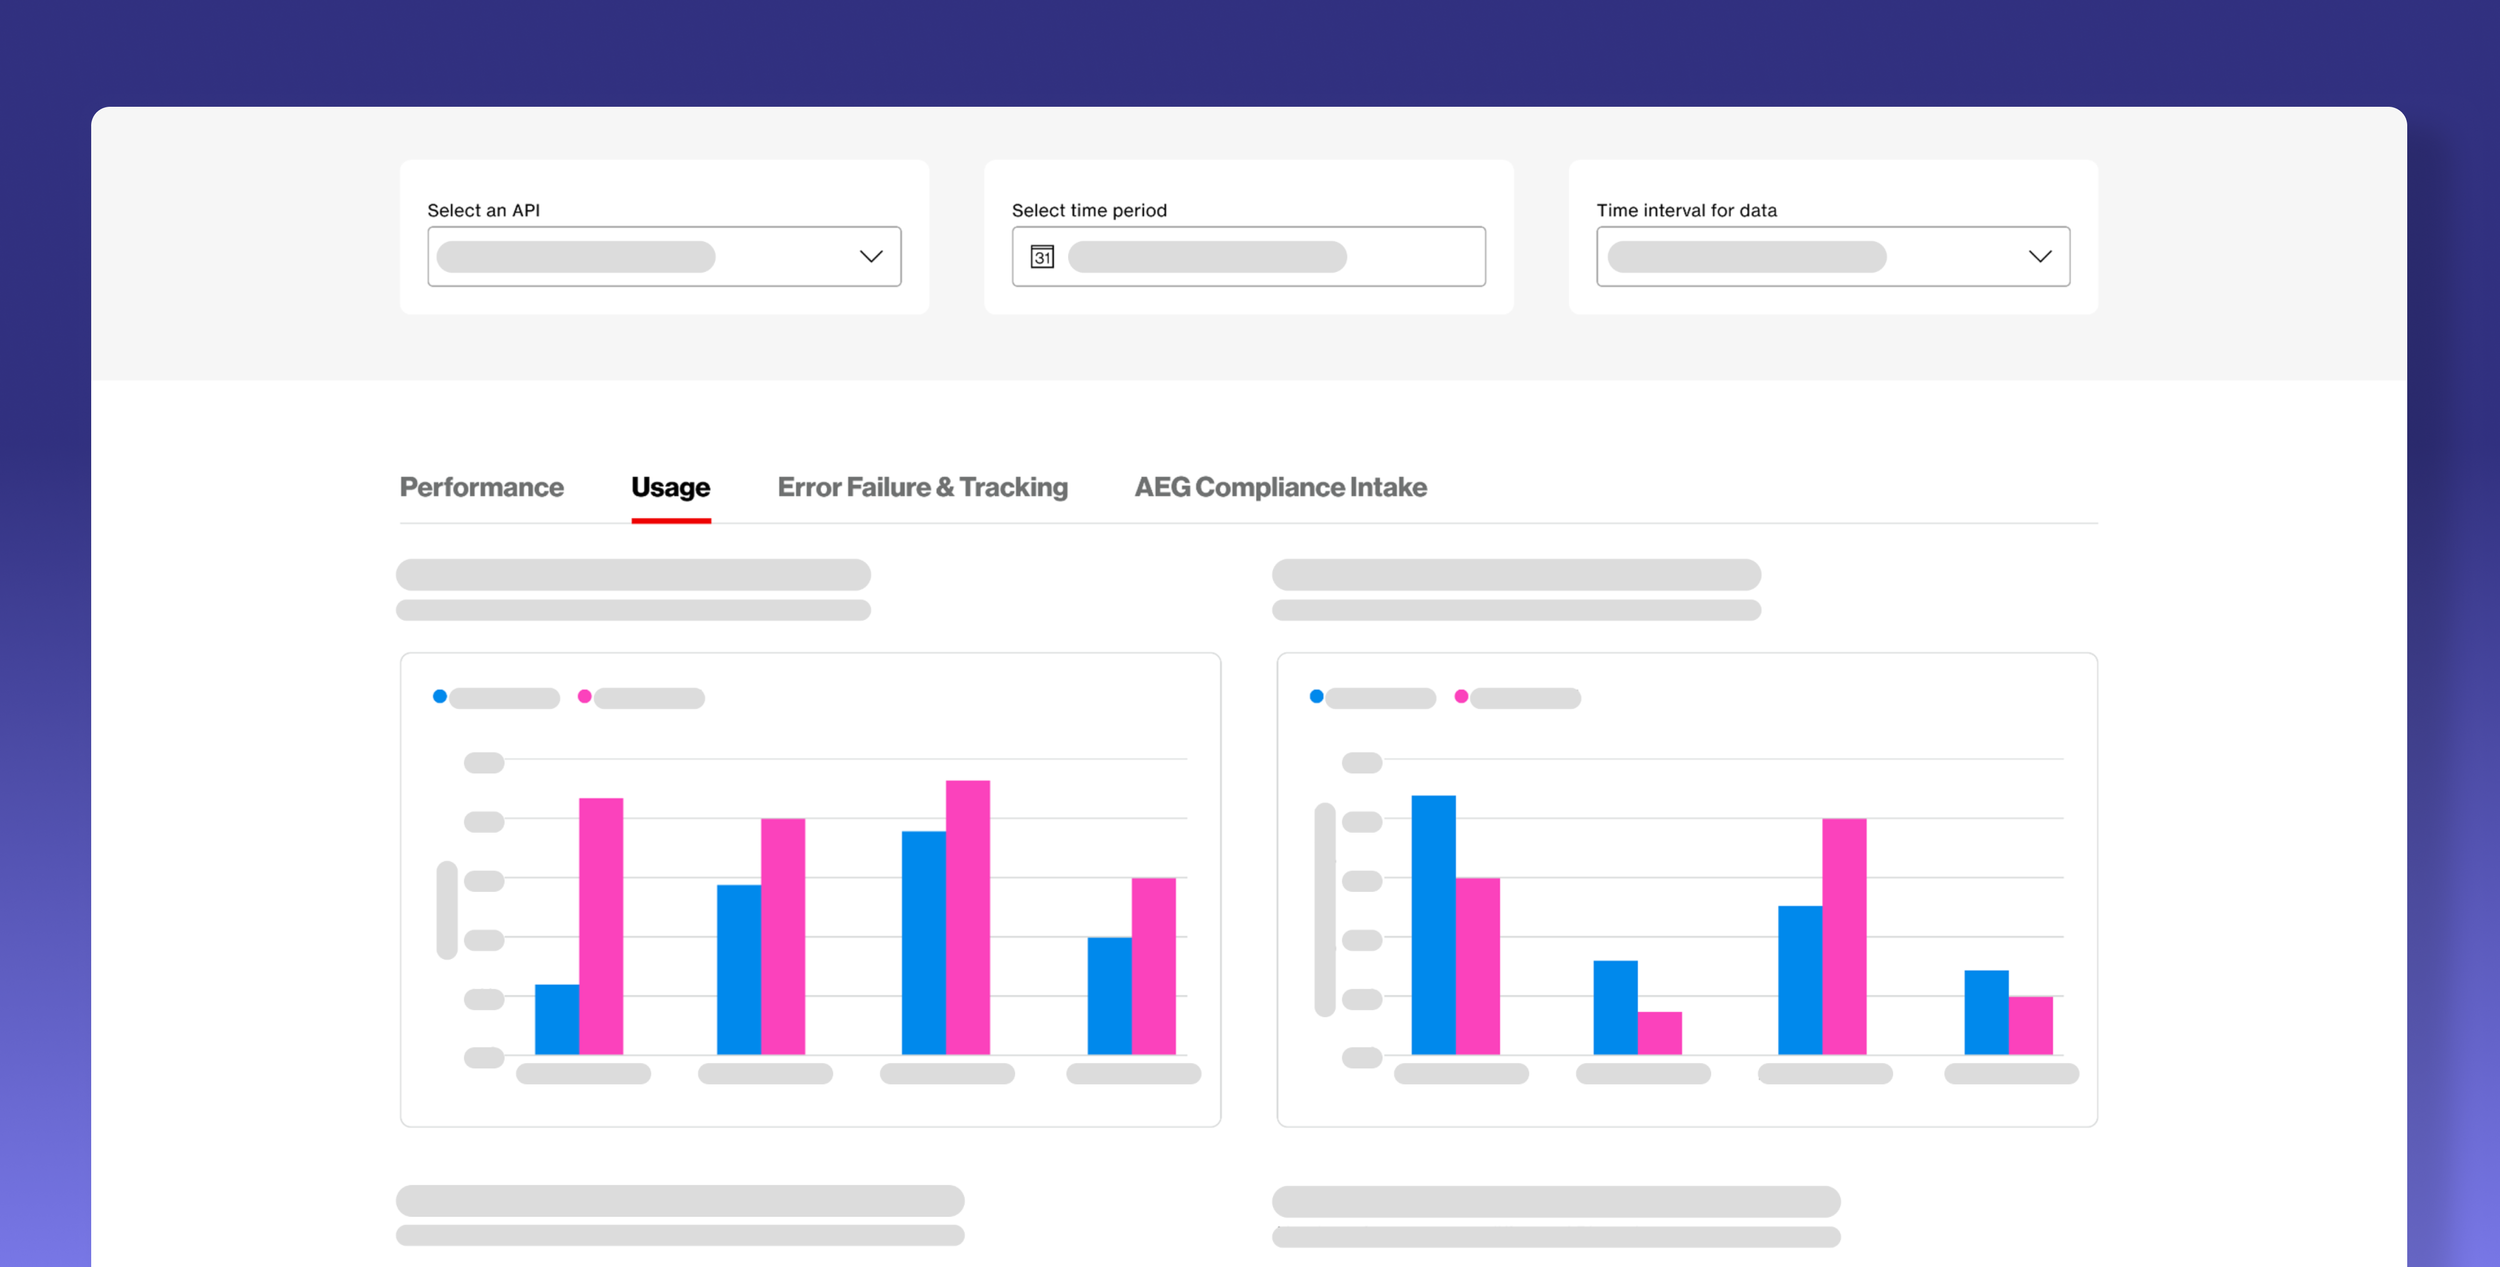
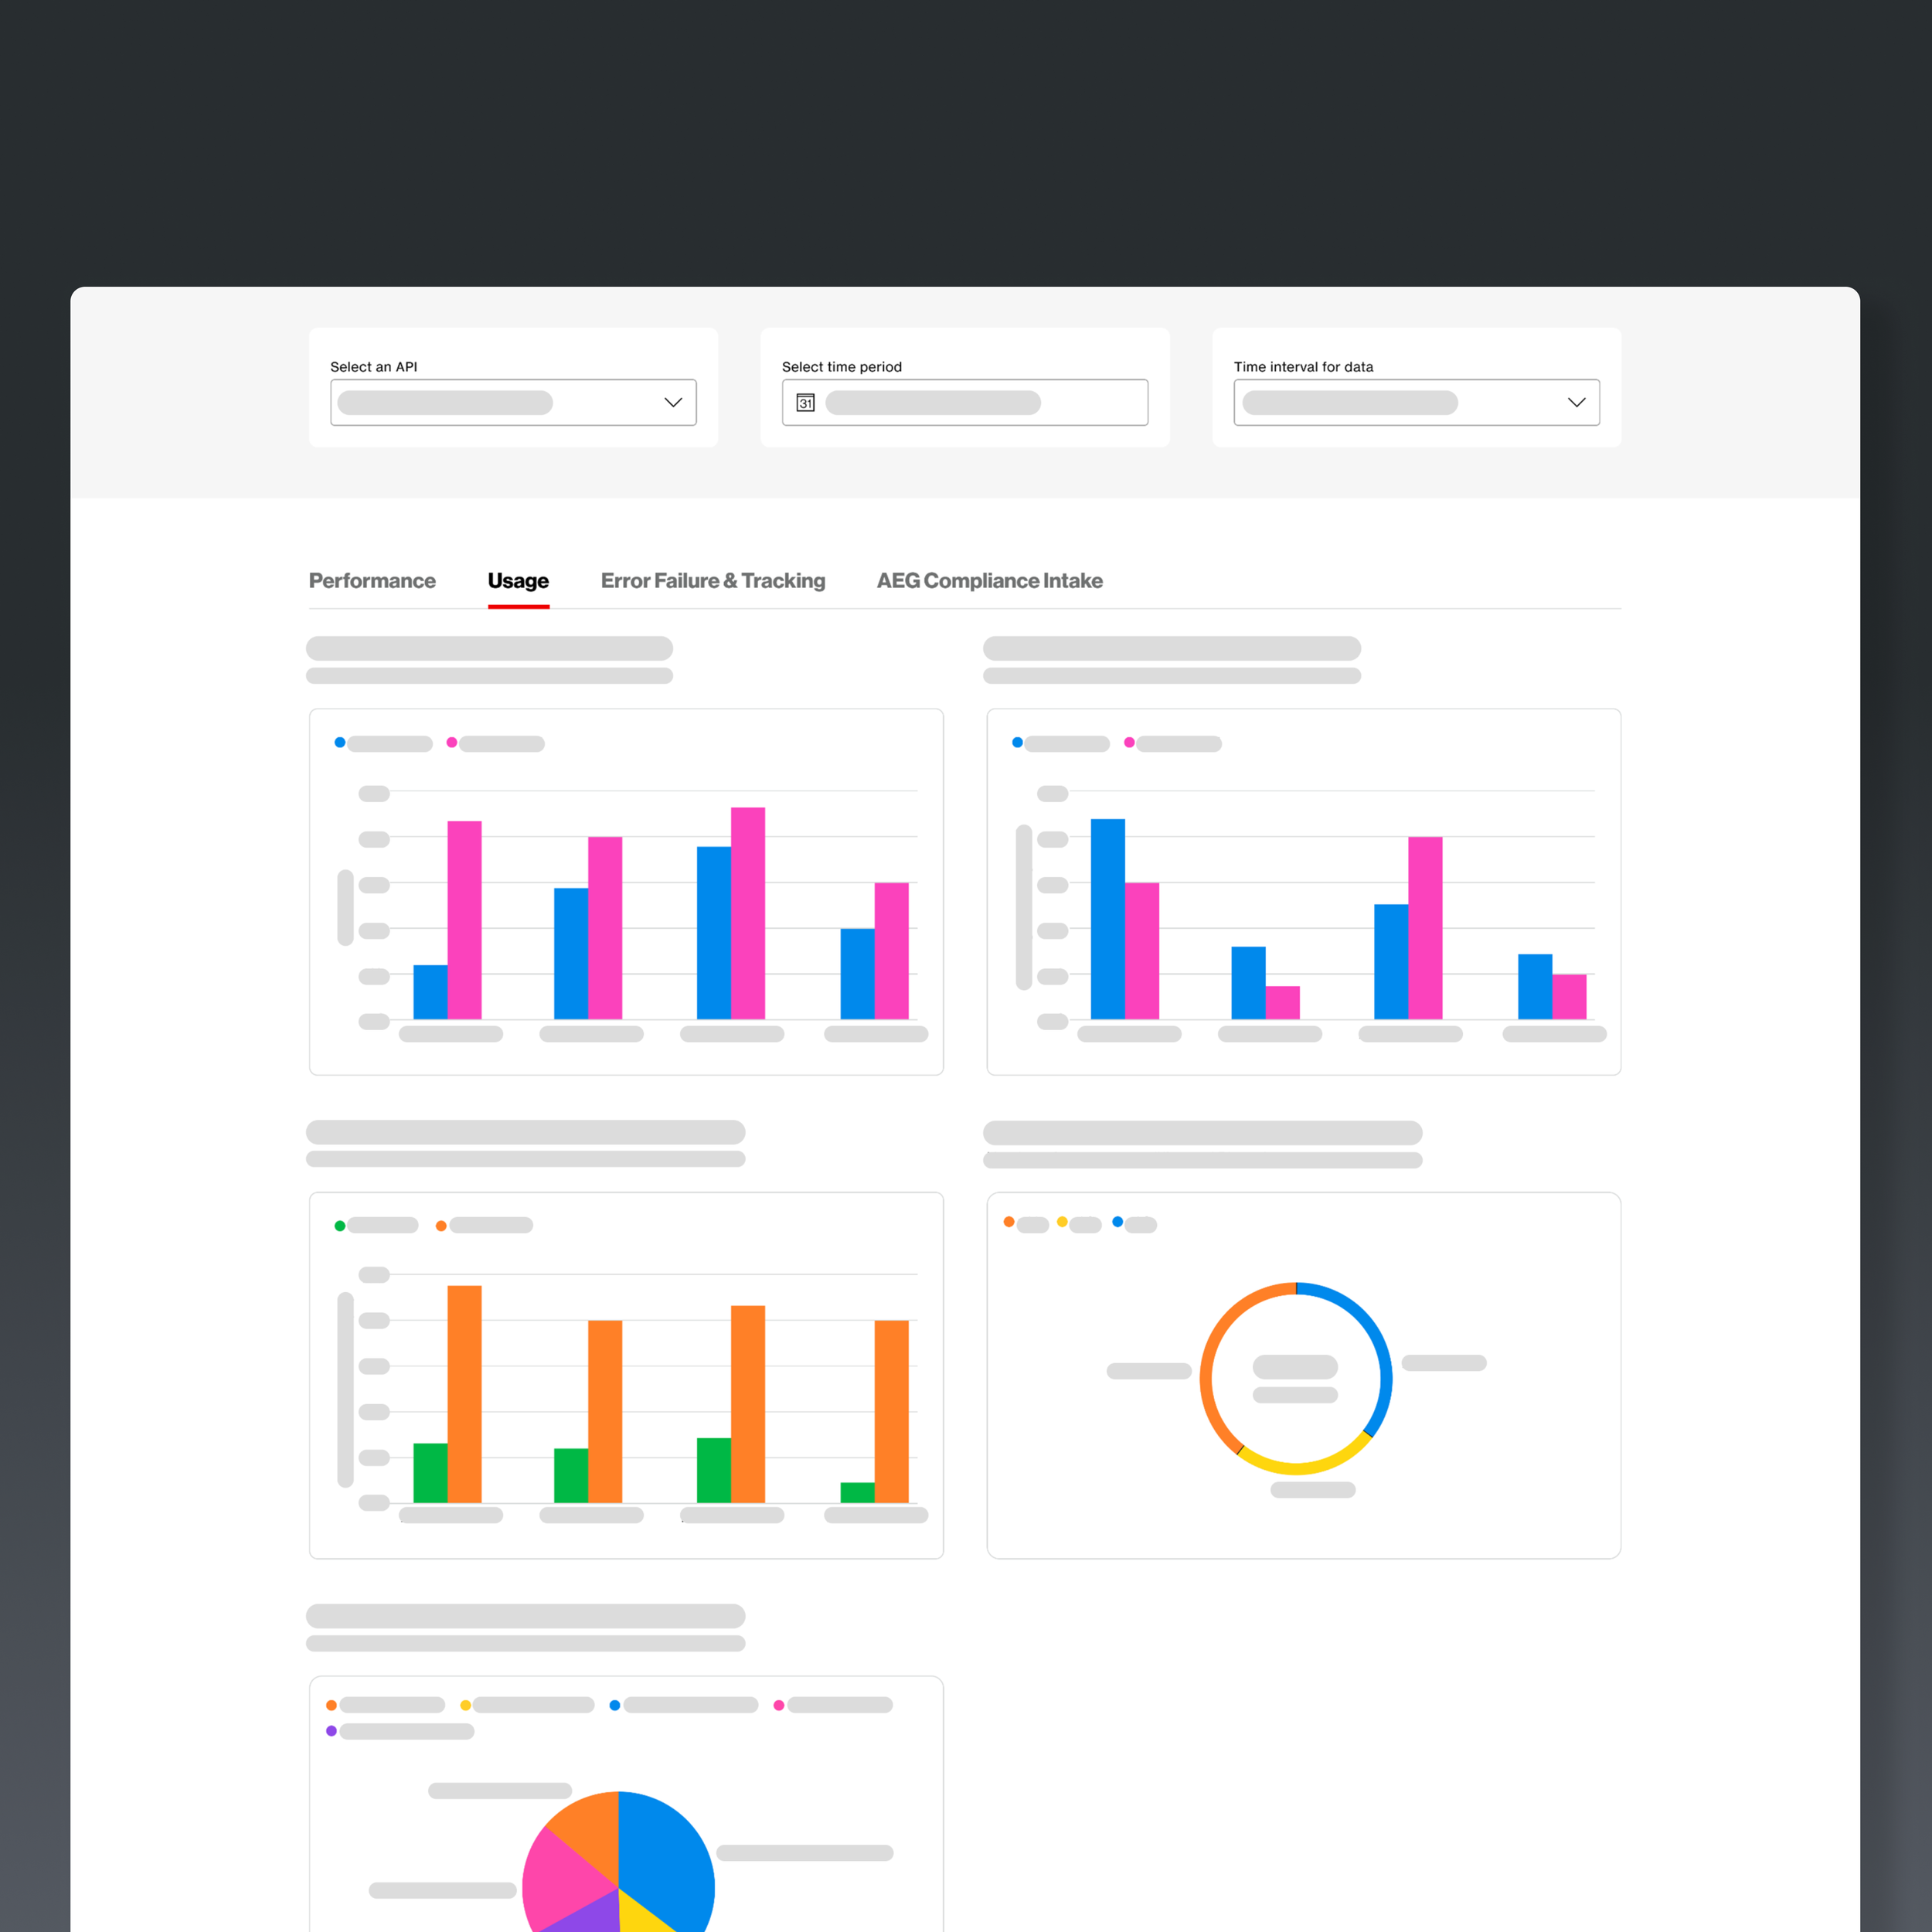
Information Design & Taxonomy: Engineered a comprehensive library of custom visualizations, selecting optimal data representations to ensure clarity, accuracy, and rapid insight.
Cross-Organizational Integration: Orchestrated the onboarding of five distinct teams within the Technology and Product Development organization, unifying their disparate metrics into a cohesive reporting suite.
Operational Governance: Acted as the primary point of contact for cross-functional team leads, managing the monthly data acquisition lifecycle and ensuring reporting integrity.
Strategic Partnership: Collaborated with KPI specialists and Product Managers to define and track performance benchmarks that drive long-term organizational growth.
Request a prototype demo
Due to the proprietary nature of my work, this portfolio focuses on project outcomes rather than internal methodologies. While I cannot share additional documentation publicly for security reasons, I am happy to provide a live 1:1 demo. I simply ask that no screen captures be taken during our session. In an industry built on trust and security, protecting this content remains my top priority.