
TPD Data Visualization:
Utilizing Data-Driven UX to Steer Enterprise Strategy
True growth demands more than intuition; it requires a clear vantage point. Our Metrics Dashboards serve as the "pulse" of our ecosystem, distilling complex KPIs into a visual narrative of performance. By mapping evolution over time, these tools do more than record data—they expose the pain points that define our next steps. We believe no system is ever "finished." These insights are the compass for our continuous improvement and deeper connection.
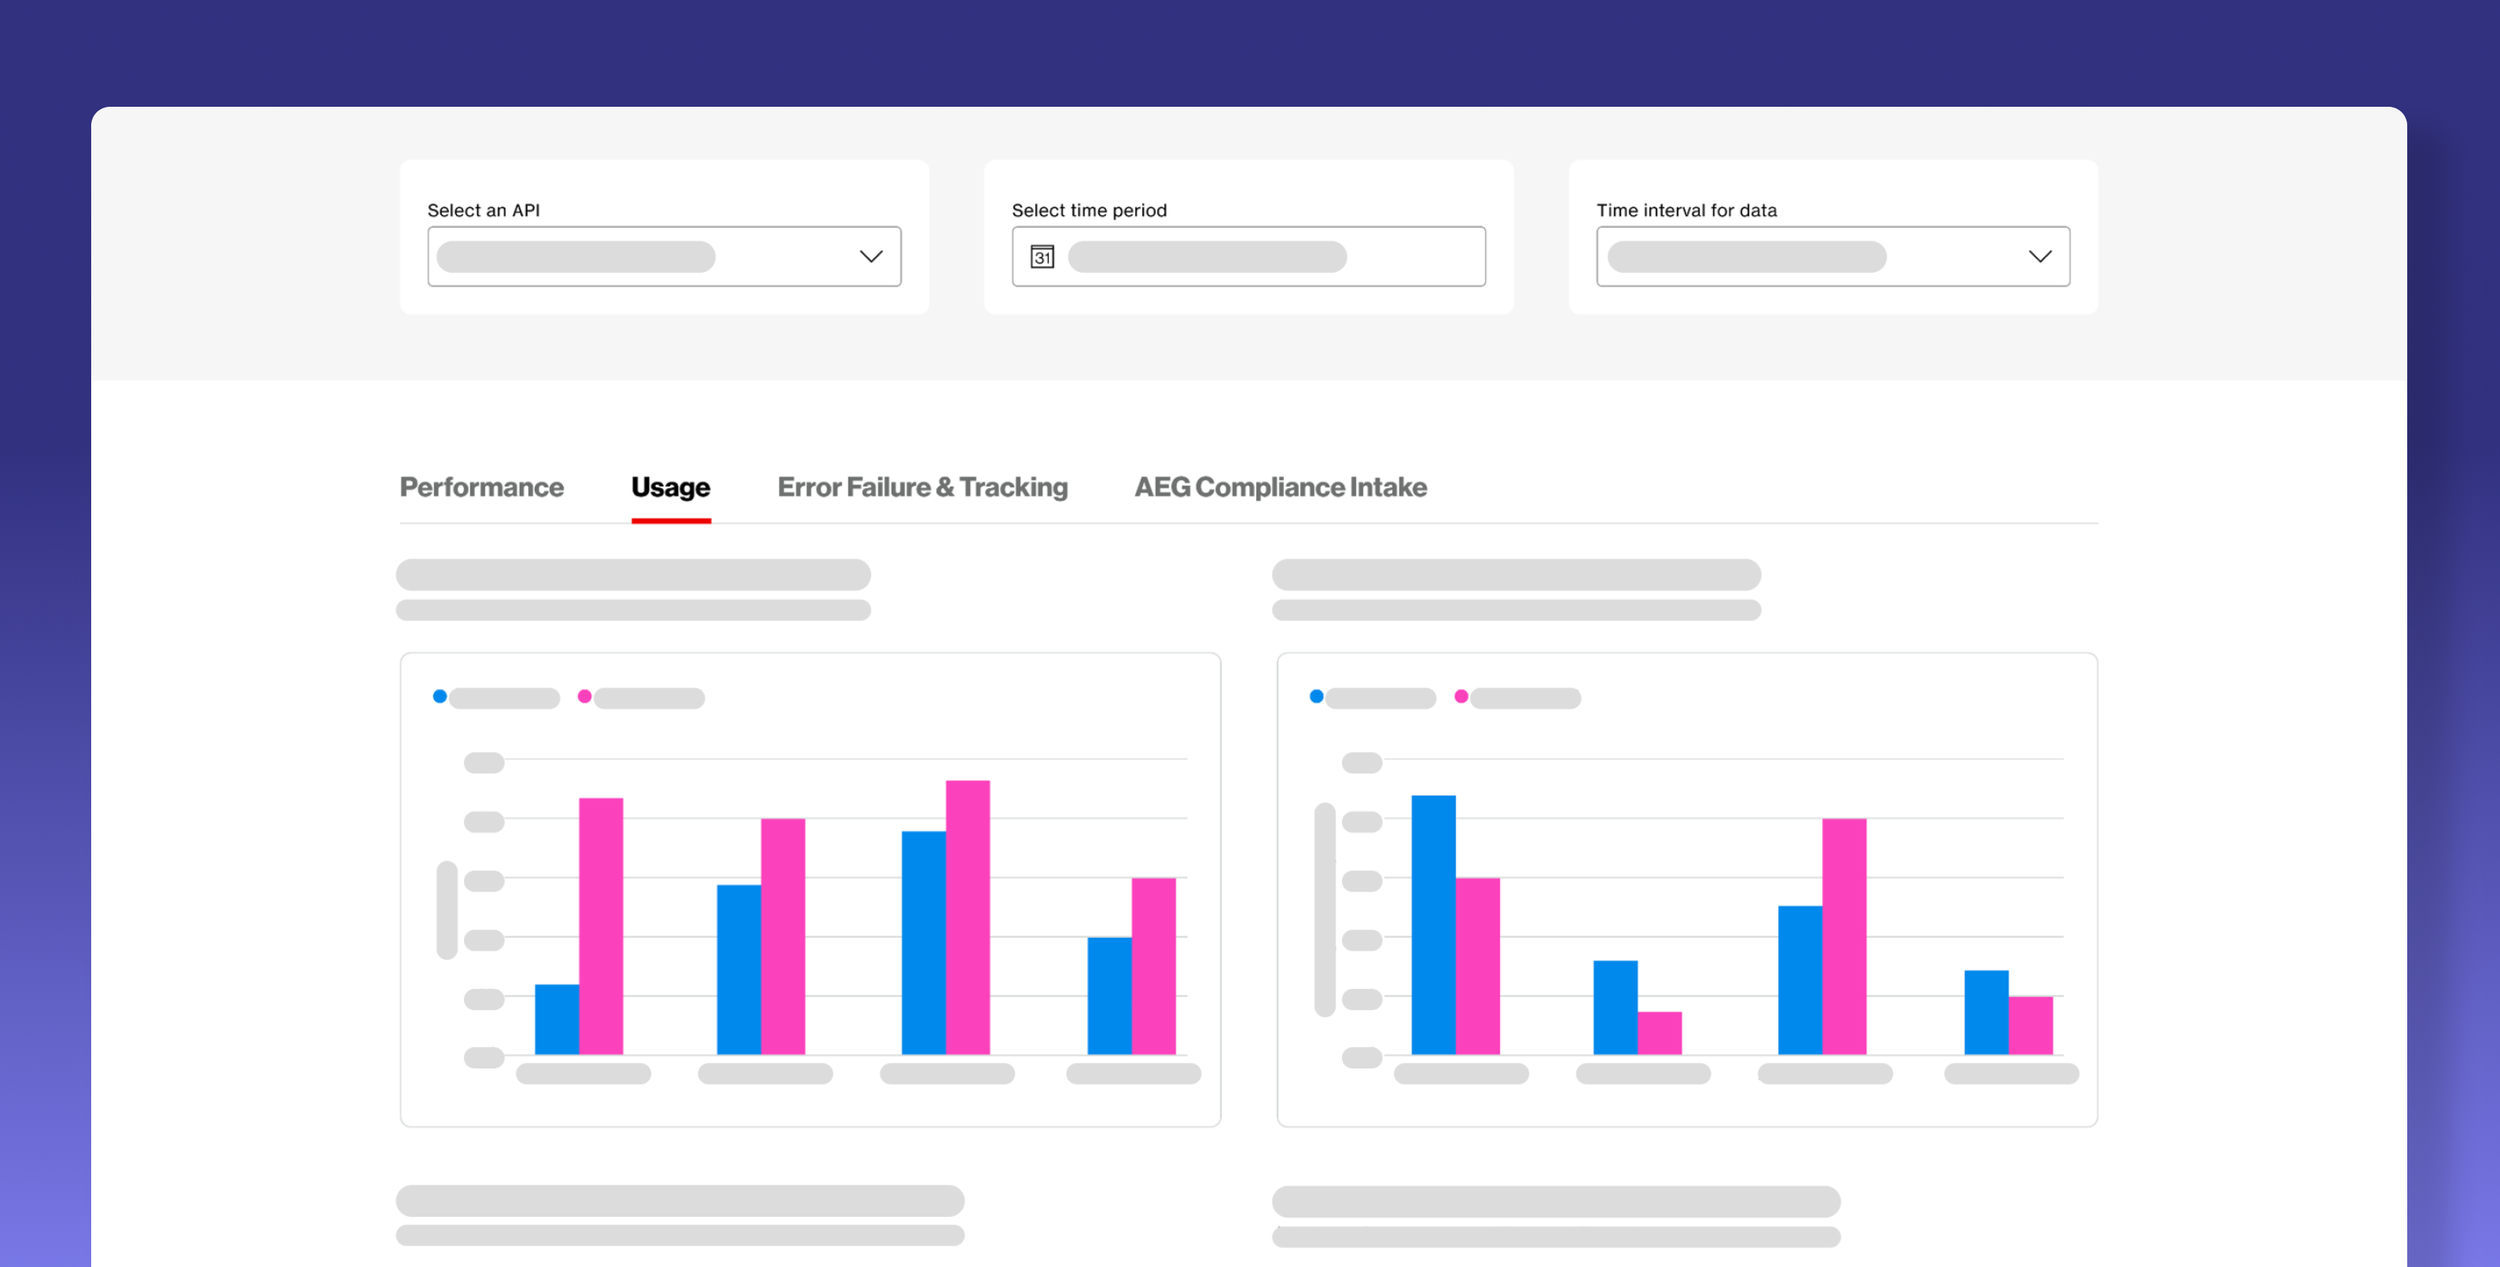
30-second Project summary
Your time is important to me and you look at a million of these every day… So here's a quick summary of the work I did for the Technology and Product Development org’s Data Visualization.
Problem:
The Technology and product Development Data Visualization project addressed the lack of real-time visibility in a massive organization where leadership struggled to bridge the gap between fragmented technical logs and actionable business strategy.
Strategy:
My strategy was to orchestrate the integration of seven disparate teams within Verizon’s Technology and Product Development org and in establishing rigorous operational governance, I created an executive "command center" that shifted leadership from intuition-based guesses to data-driven metrics and efficient resource allocation.
Business Result:
The project culminated in the TPSS Dashboard - an essential "source of truth" that provided senior leadership with total visibility into the API First journey, along with six other teams within our org, and surfaced chronic operational blockers. This shift to a data-backed culture empowered the Vice President to intervene in real-time, optimizing resource allocation and ensuring engineering efforts were perfectly aligned with Verizon’s long-term strategic goals.
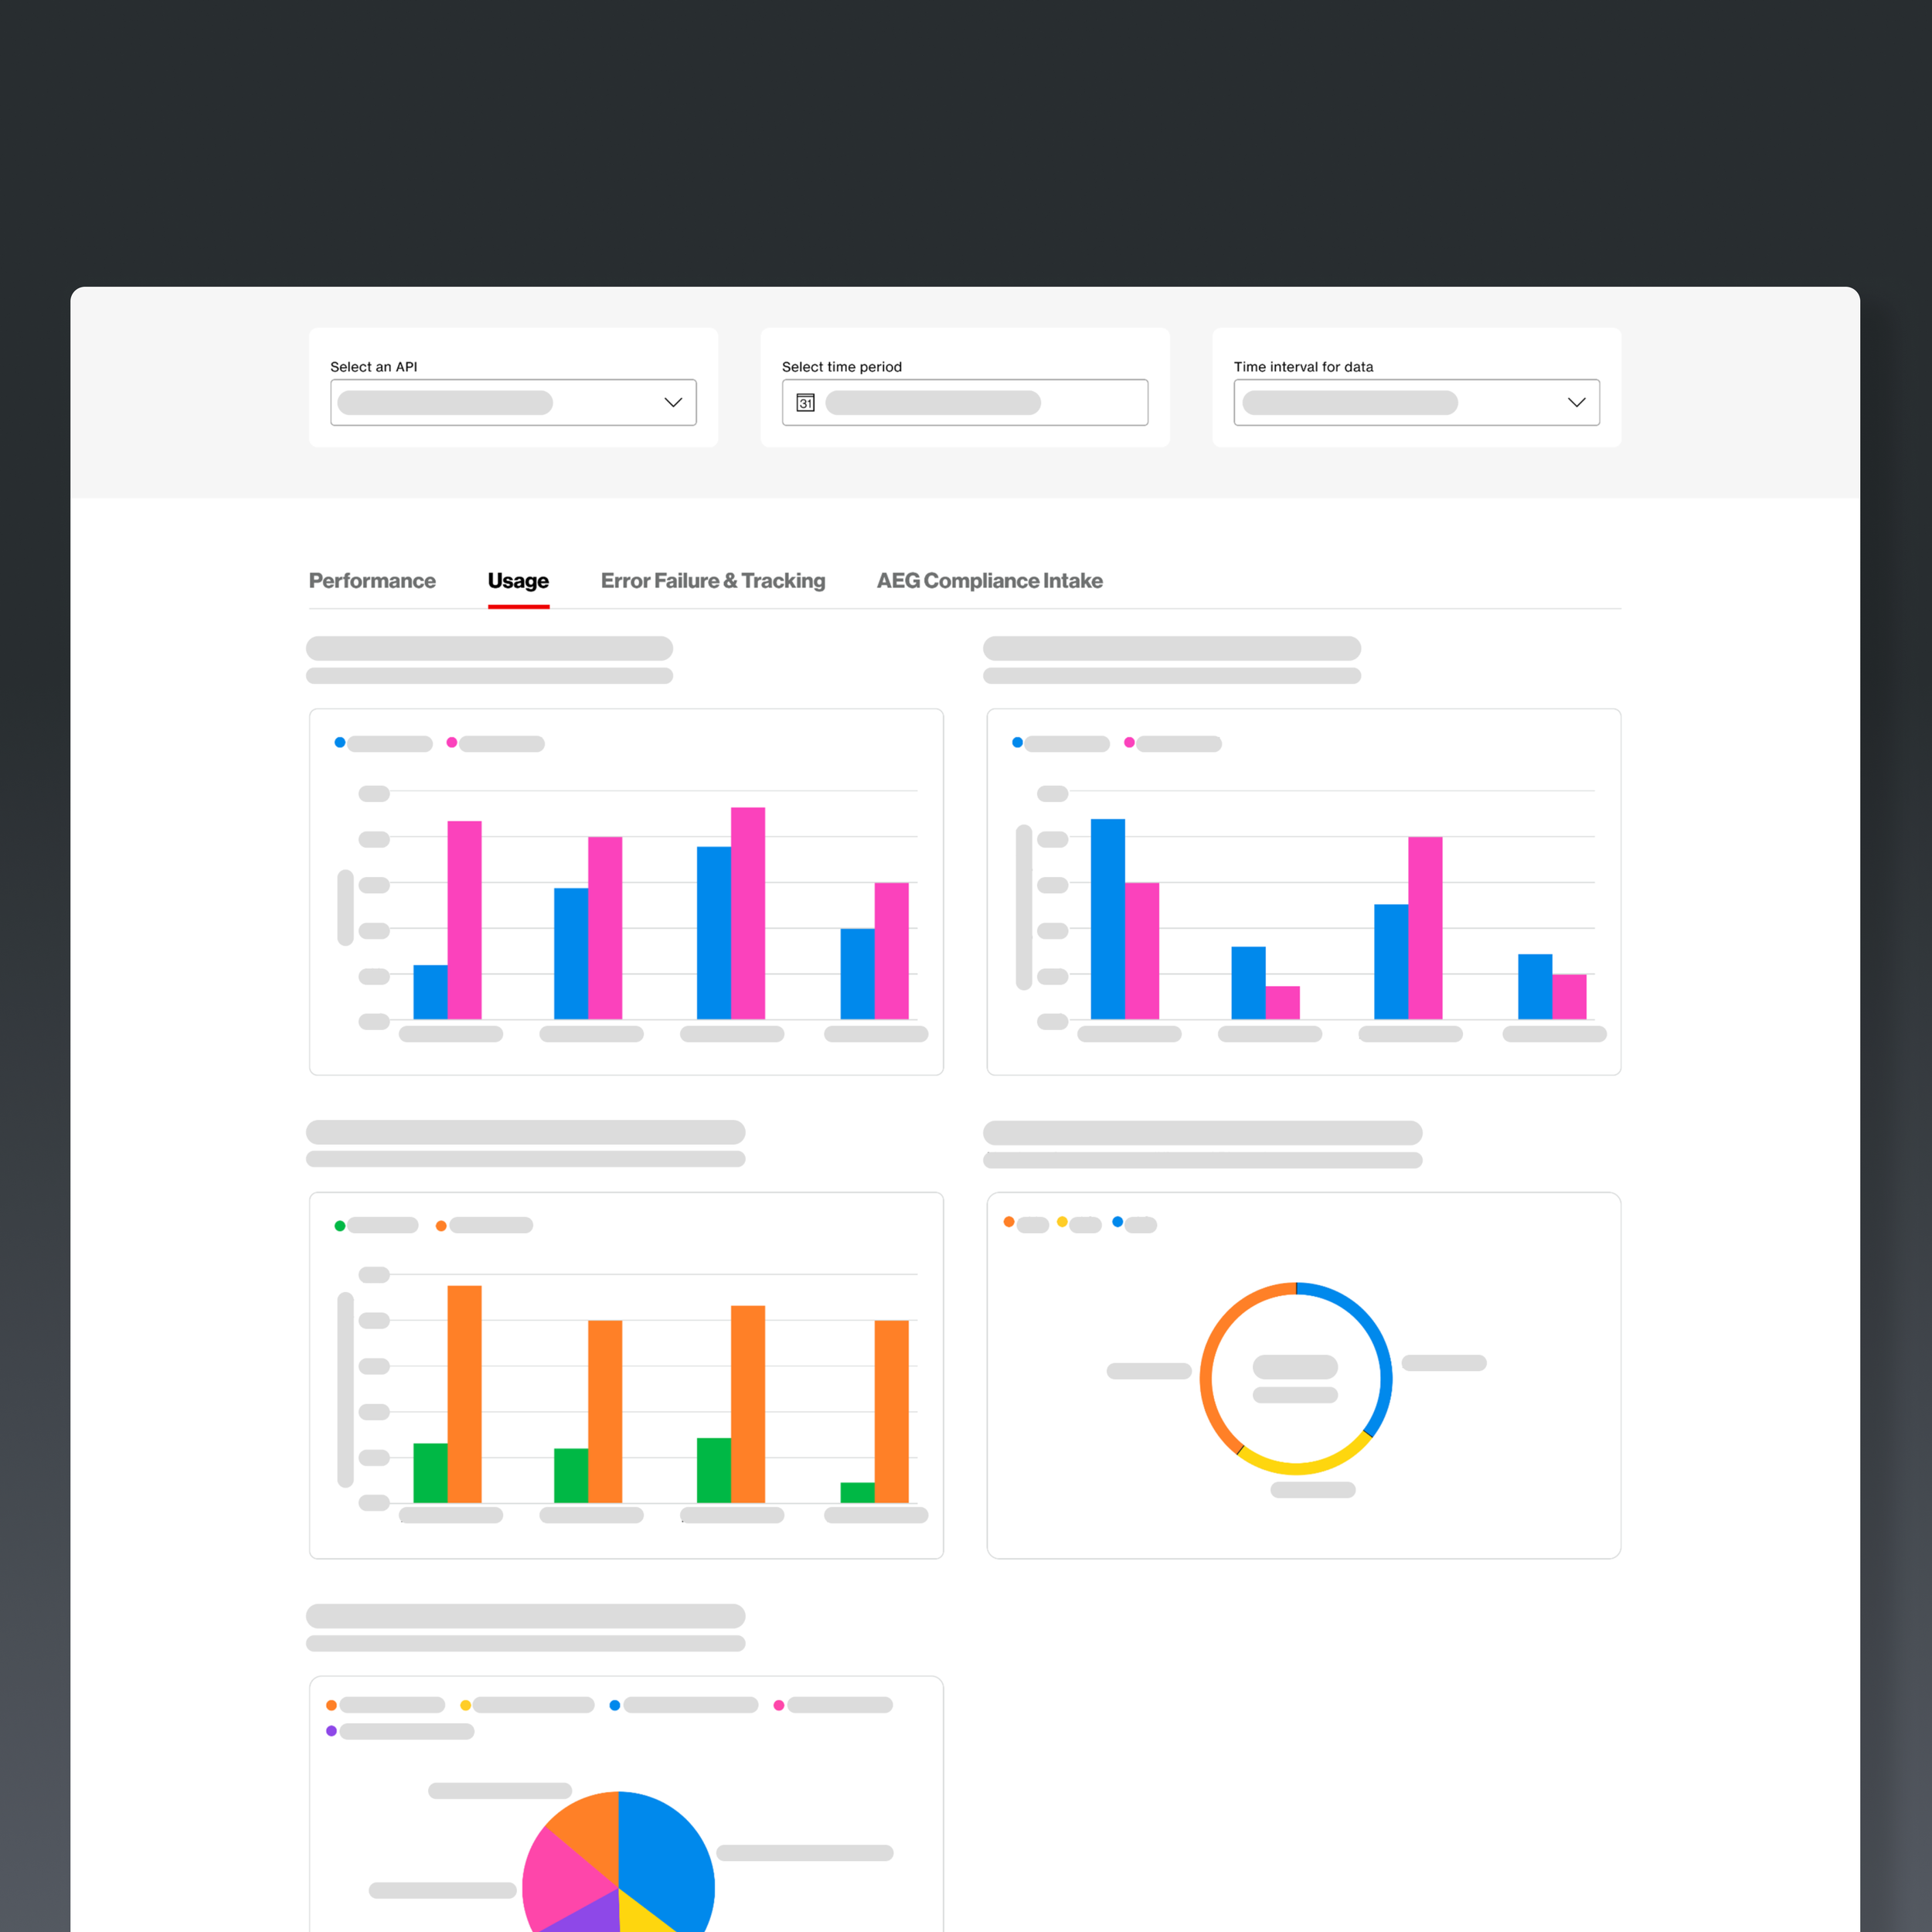
My Leadership contributions:
Data Experience Lead: Spearheaded the end-to-end design for the metrics ecosystem, transforming complex raw data into a strategic narrative for the Vice President and senior leadership.
Information Design & Taxonomy: Engineered a comprehensive library of custom visualizations, selecting optimal data representations to ensure clarity, accuracy, and rapid insight.
Cross-Organizational Integration: Orchestrated the onboarding of five distinct teams within the Technology and Product Development organization, unifying their disparate metrics into a cohesive reporting suite.
Operational Governance: Acted as the primary point of contact for cross-functional team leads, managing the monthly data acquisition lifecycle and ensuring reporting integrity.
Strategic Partnership: Collaborated with KPI specialists and Product Managers to define and track performance benchmarks that drive long-term organizational growth.
Overview:
I led the UX and content strategy for the API First Platform Dashboard, a high-level strategic tool designed to provide visibility into the health and progress of Verizon’s technology transformation. By translating complex engineering metrics into actionable business intelligence, I empowered executive leadership to identify operational blockers and maximize the strategic output of the entire Technology and Product Development (TPD) organization.
Impact at a Glance:
Executive Adoption: Adopted by the Vice President of Technology and Product Development as the primary source of truth for team tracking.
Strategic Visibility: Identified monthly key pain points and bottlenecks that were previously invisible to leadership.
Operational Efficiency: Provided the data necessary to reallocate resources, resulting in a major improvement in strategic alignment.
The problem:
In a massive organization like Verizon, leadership often lacks real-time visibility into the "ground truth" of engineering teams.
The Data Noise: High-level leaders were inundated with fragmented technical logs that lacked business context.
The "Black Box" of Progress: It was difficult for the VP to identify which teams were stalled by technical debt versus those ready to scale.
The Strategic Risk: Without a unified dashboard, leadership was forced to make "best-guess" decisions regarding resource allocation and TPD strategy.
The Mission:
Bridging the gap between code and strategy
The mission of this project was to transform raw engineering data into a Strategic Command Center—providing leadership with the transparency needed to track progress, identify blockers, and optimize the velocity of TPD initiatives.
“I’ve had the pleasure of working with Ryan, and he is one of those rare people who can jump into any new challenge and immediately make an impact. He is incredibly versatile and has a real talent for picking up new skills quickly. Whether it is learning a new tool, adapting to a new workflow, or taking on responsibilities outside his original role, Ryan always handles it with confidence and clarity”.
Chris CapPella
Senior UX & Product Designer - Verizon
User research:
Executive Stakeholder Interviews: Conducted 1-on-1 sessions with Verizon leadership (Directors and VPs) to identify their "North Star" metrics and understand exactly which data points influenced their quarterly budgeting and resource allocation.
Workflow Mapping for Reporting: Documented the current, manual process of how data traveled from an engineer's log to an executive's slide deck, identifying "latency" in communication and points where data was often misinterpreted.
KPI Prioritization: Led conversations with technical leads to categorize hundreds of available data points into Must-have, Should-have, Could-have, and Won't-have for the initial dashboard launch to avoid "information overload."
Persona Segmenting: Defined three distinct user tiers to ensure the dashboard served everyone:
The Executive: Needs high-level health indicators and trend lines (the "Pulse").
The Product Manager: Needs adoption rates and user behavior patterns to drive the roadmap.
The Engineer: Needs granular error rates and latency logs for real-time troubleshooting.
Audit of Existing Data Silos: Investigated disparate data sources (Splunk, Grafana, internal APIs) to understand the technical constraints of "real-time" reporting and how to normalize data from different teams into a single UI.
Iterative Refinement: Leveraged continuous feedback loops to identify lingering UI friction, refine complex interactions, and validate that the consolidated design successfully eliminated administrative overhead and context-switching.
Prototyping:
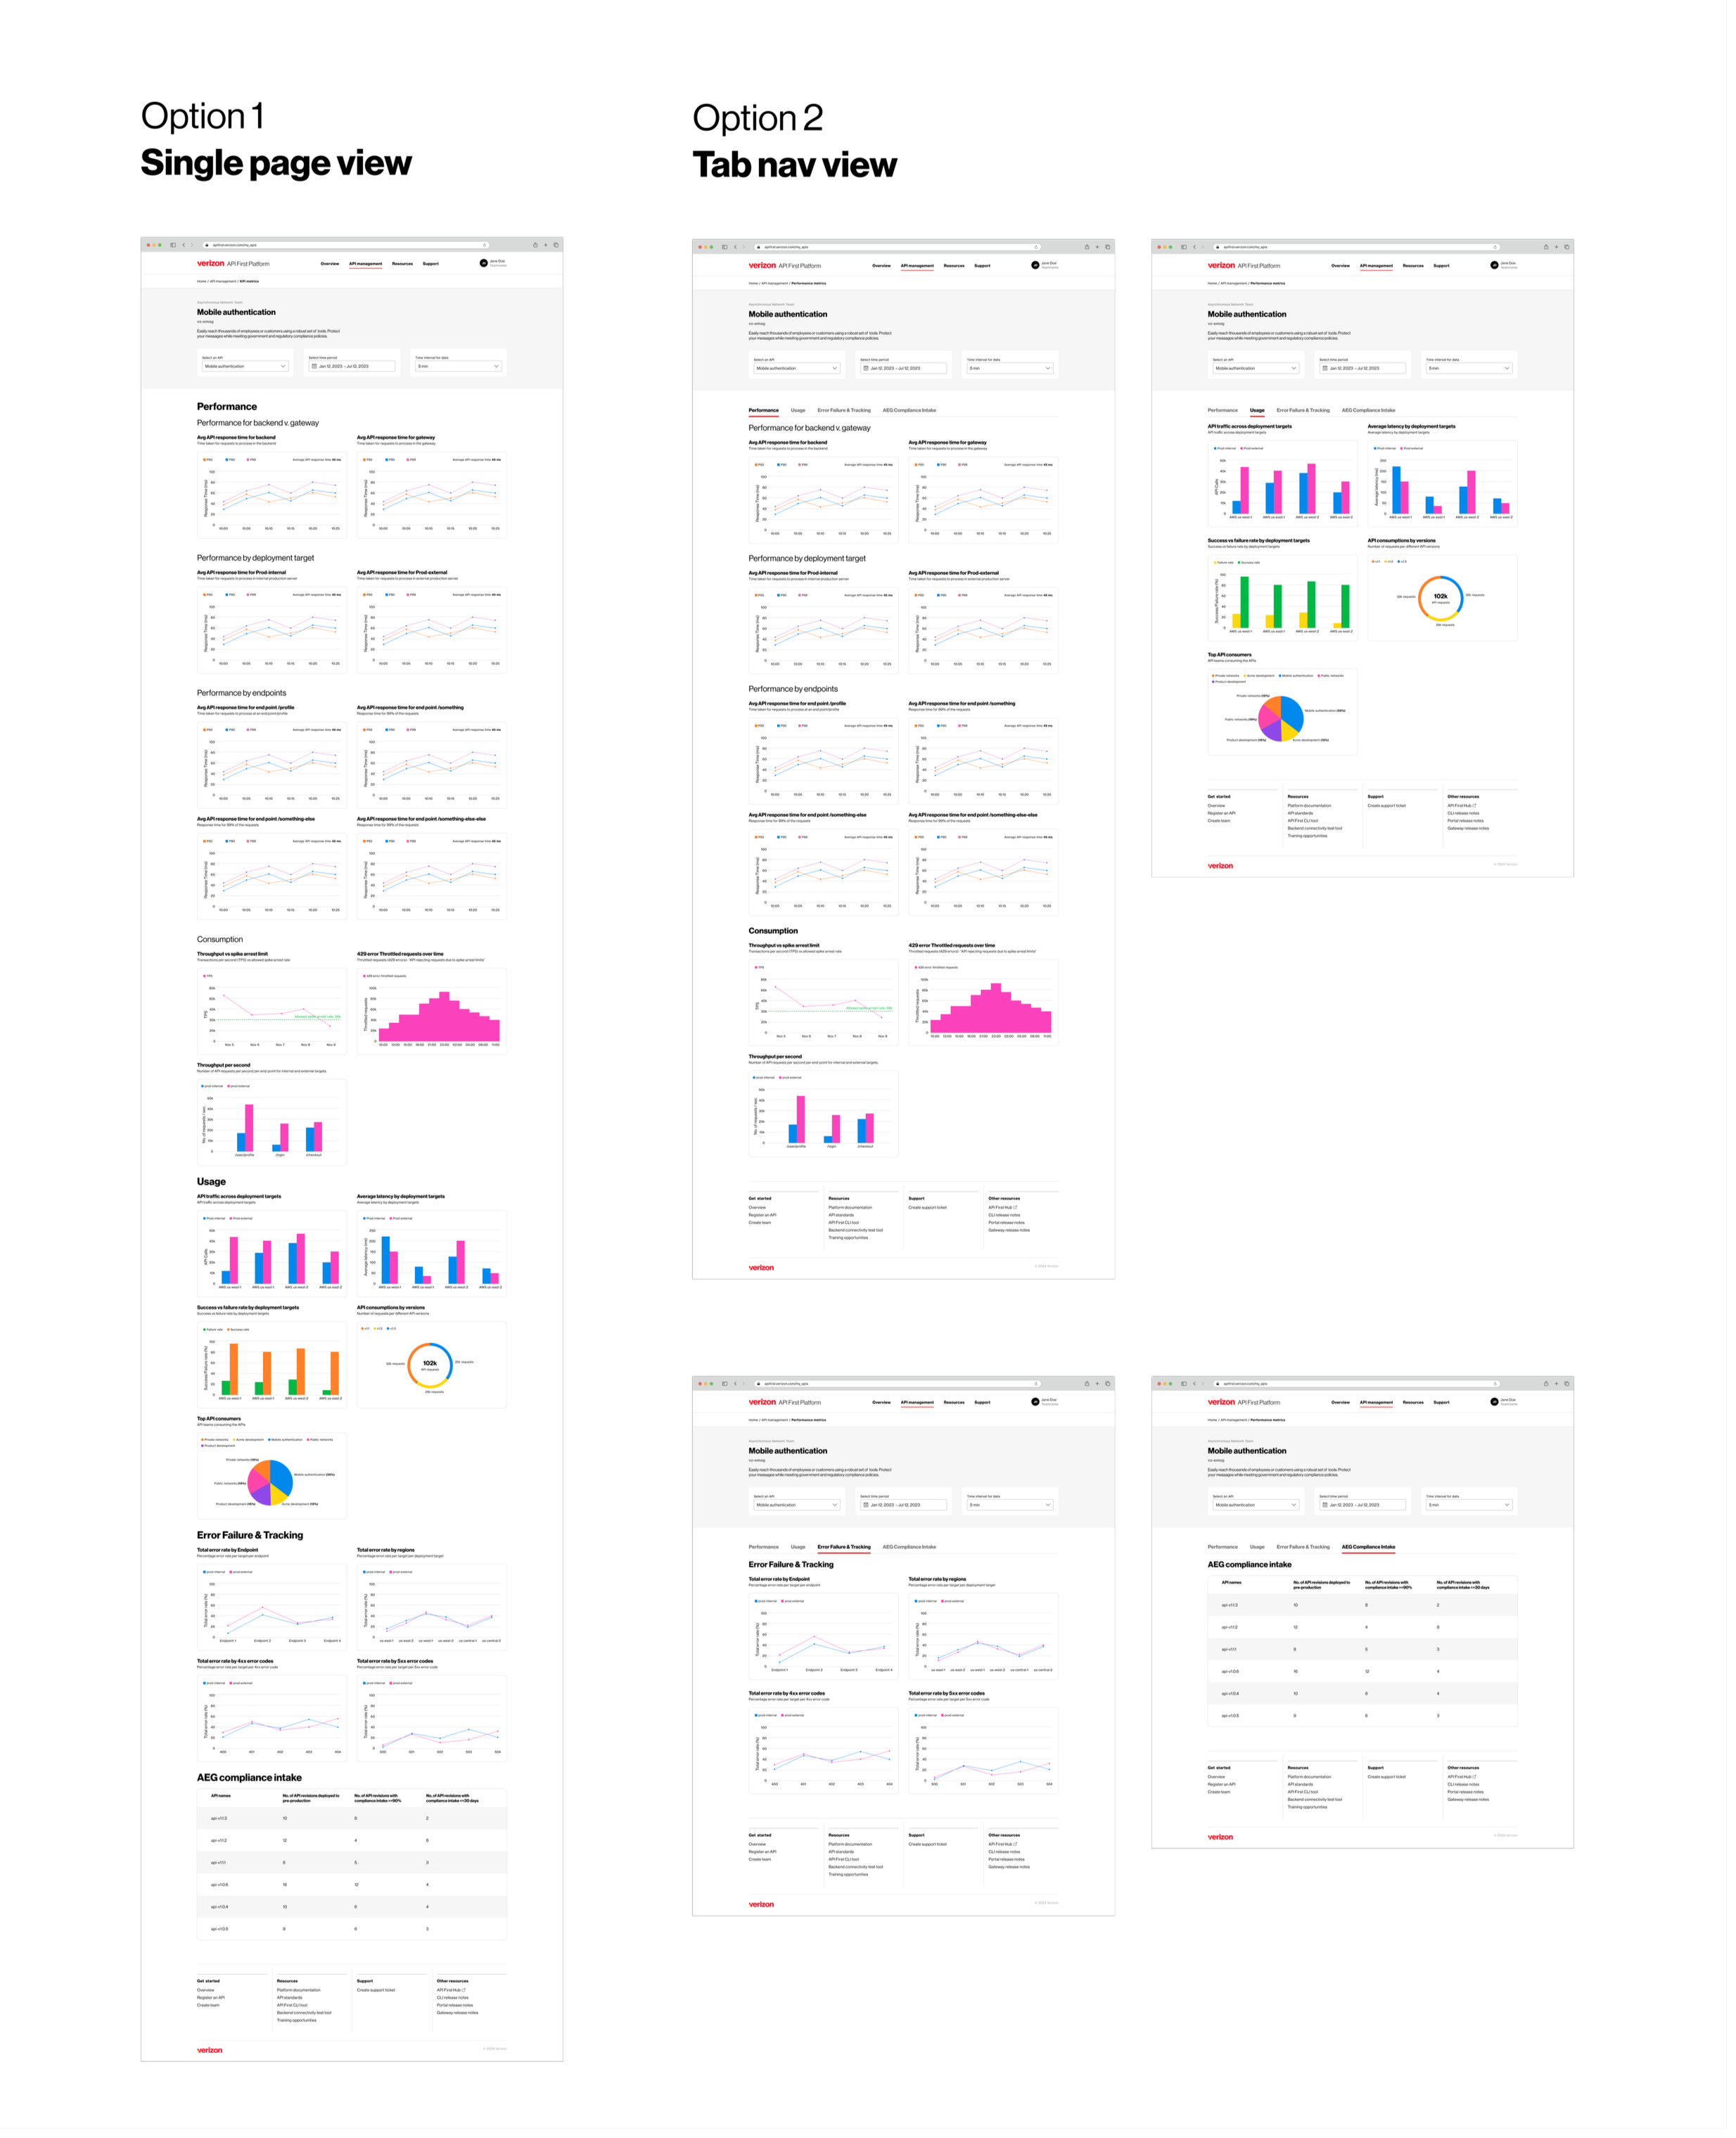
Information Hierarchy Mapping: Defined the "Drill-Down" architecture, ensuring the UI moved logically from high-level health "traffic lights" (Red/Amber/Green) for executives to granular telemetry for engineering teams.
Data Visualization Stress-Testing: Prototyped various chart types (Sparklines, Heatmaps, and Sankey diagrams) using real, messy datasets to ensure the visualizations remained legible even during high-velocity traffic spikes or service outages.
Executive "At-a-Glance" View: Created a specialized "Executive Summary" landing page that prioritized three core pillars: Adoption Growth, System Stability, and Active Roadblocks.
Interactive Filtering & Tooltips: Designed a robust filtering system in Figma that allowed users to toggle between different business units, timeframes (Last 24h vs. Last Quarter), and specific API products without page reloads.
The Outcome:
Using data as an Essential tool to facilitate growth
The Platform Strategy Dashboard became an essential tool for Verizon’s most senior technology leaders.
Identifying Pain Points: The dashboard successfully surfaced chronic blockers in [Specific Area, e.g., Cross-Team Security Reviews], allowing the VP to intervene and streamline the process.
Data-Driven Intervention: Leadership utilized these metrics to track team progress in real-time, moving away from anecdotal reporting toward a culture of data-backed accountability.
Final Result: By providing total visibility into the API First journey, the tool helped maximize TPD strategy, ensuring that engineering efforts were perfectly aligned with Verizon’s long-term business goals.
Due to the sensitivity of the data we collected each month, I am unable to share much more than what’s seen above. That said - I’m happy to talk through it with you in person.
See More Product Design case studies
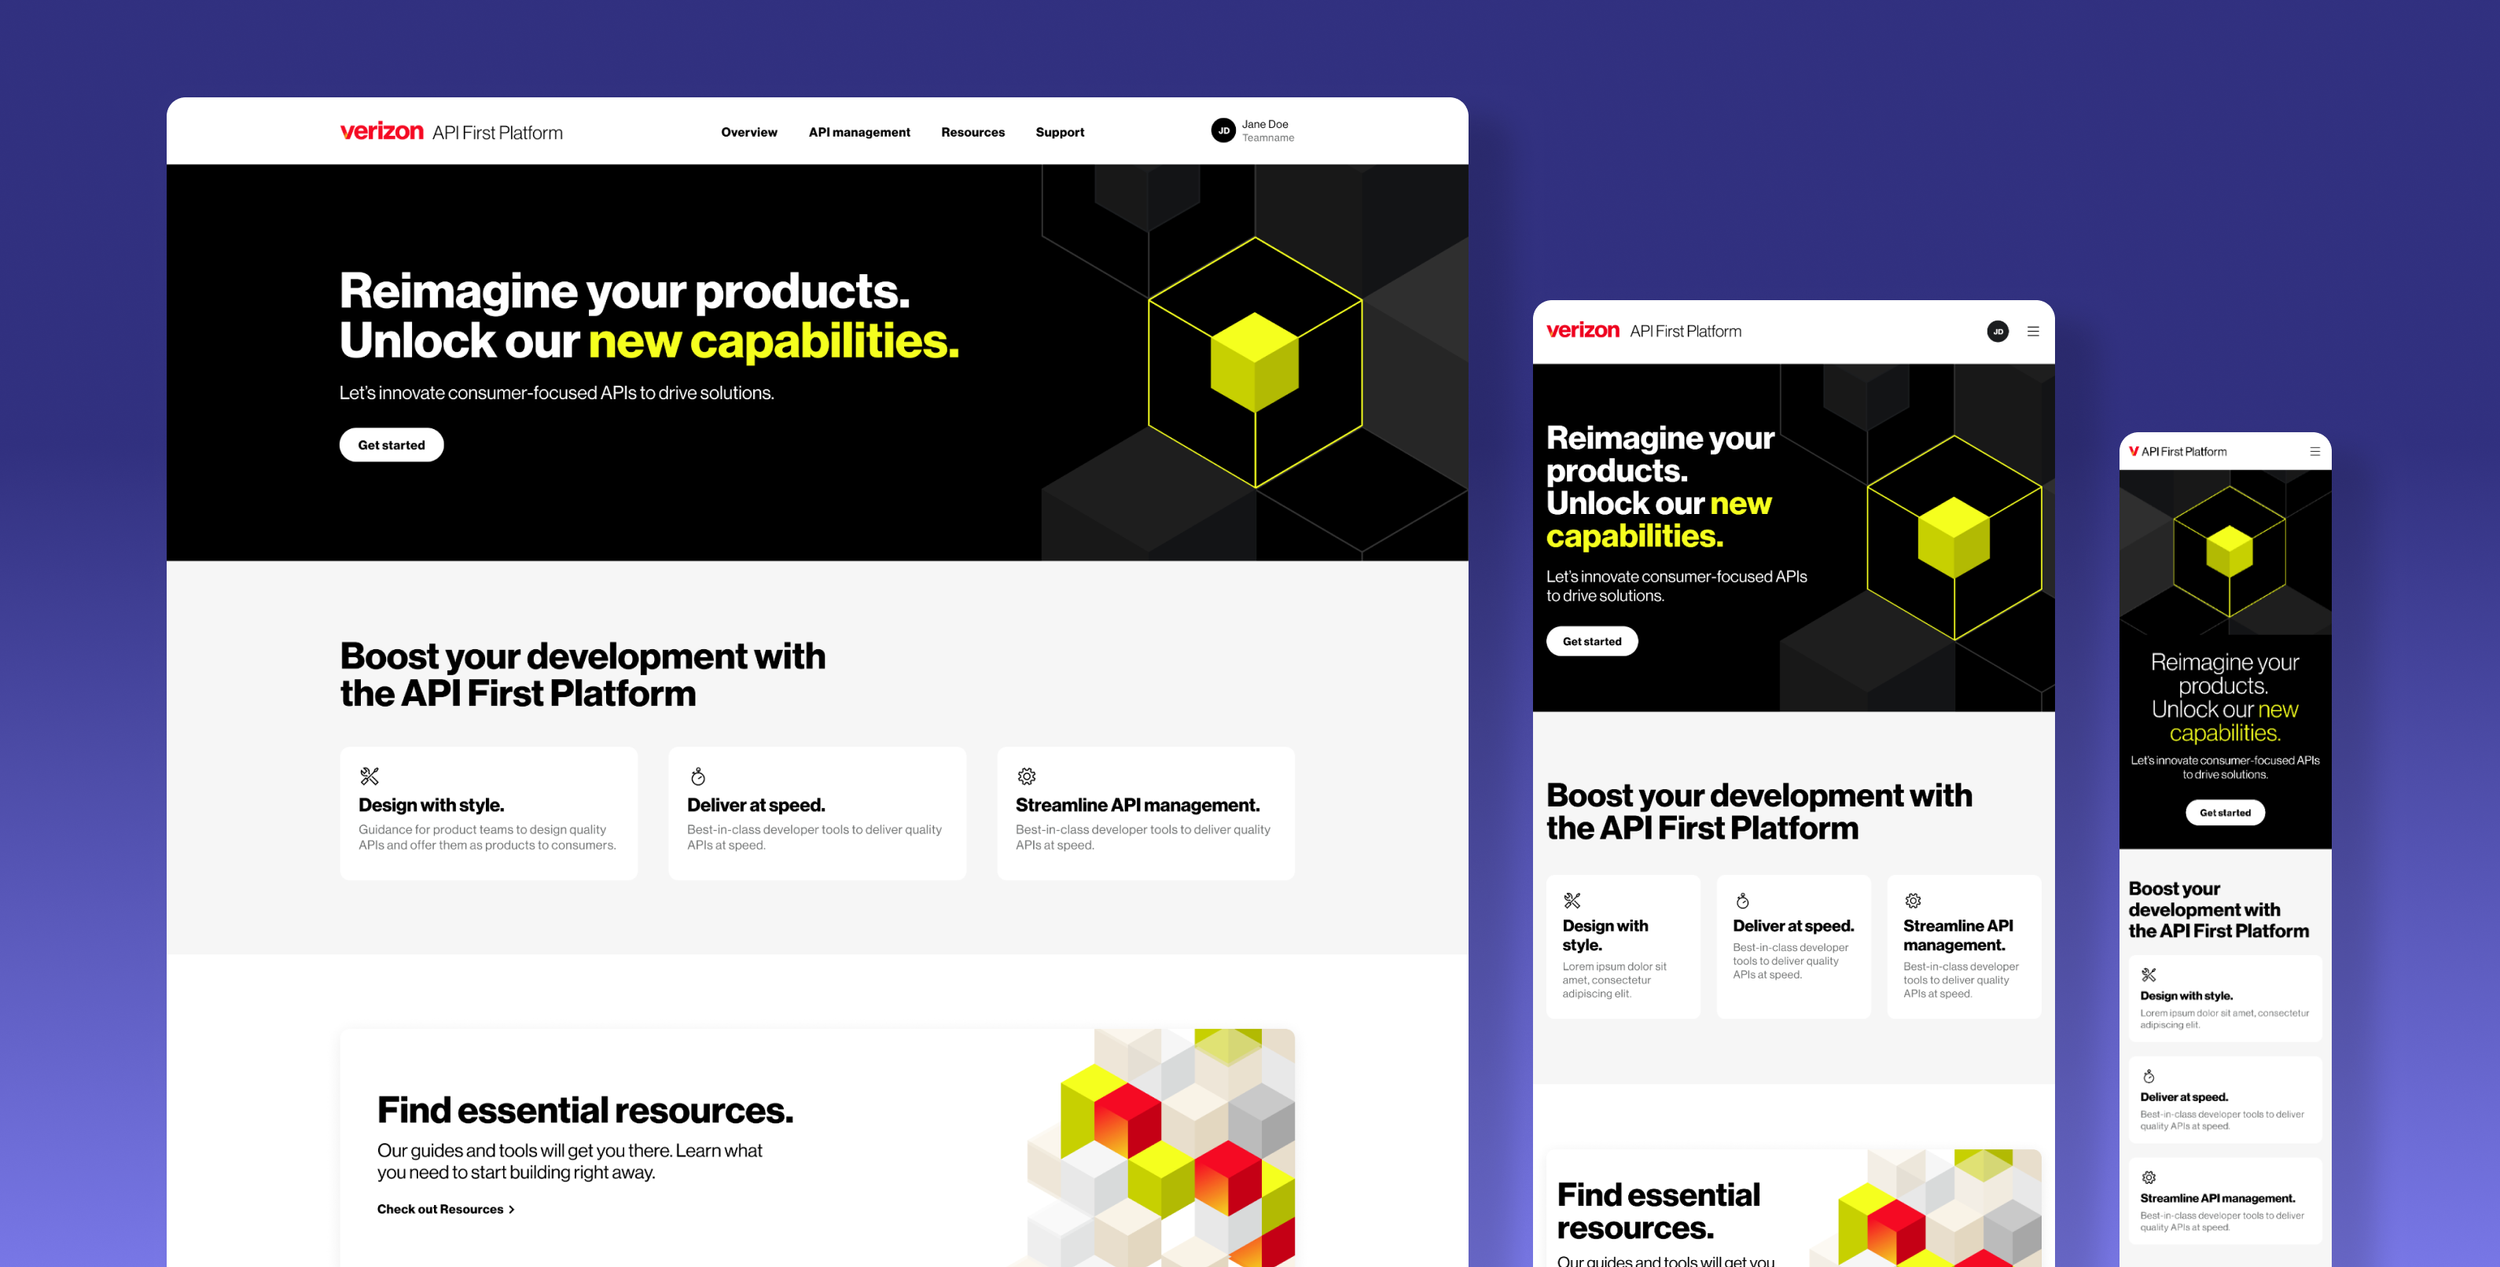
Request a prototype demo
Due to the proprietary nature of my work, this portfolio focuses on project outcomes rather than internal methodologies. While I cannot share additional documentation publicly for security reasons, I am happy to provide a live 1:1 demo. I simply ask that no screen captures be taken during our session. In an industry built on trust and security, protecting this content remains my top priority.